

‘Where is the Bitcoin?’ is a continuous debate where most people speculate instead of doing technical analysis. Though many believe technical analysis itself is speculation, that debate is for another blog. So for now, let’s try to find out the bottom of Bitcoin in the current crypto crash.
Related: Avoid Honeypot Tokens and Save your Money
So where’s the bottom?
Bitcoin is currently trading near $20,000, and it looks quite bearish on a daily chart. However, the situation seems normal if we shift to a longer time frame like a monthly chart and zoom out.
Looking at the chart below, it seems that the current dip was ‘part of the plan’ and a regular cycle that repeats almost every 4 years. If we calculate the months, Bitcoin recorded higher lows every 41 to 45 months.
You may also read: AMAZY is the Next Big Move to Earn Project in the Crypto Space
Likewise, there’s a pattern in the higher highs as Bitcoin makes a new higher high between 41 and 49 months. The last peak of Bitcoin was $69,000 in November. Taking an average of 43 months for each peak, Bitcoin is still around 29 months away from reaching a new peak – we’ll probably see Bitcoin at a new high in November 2024. That’s the peak, but where is the bottom for it?
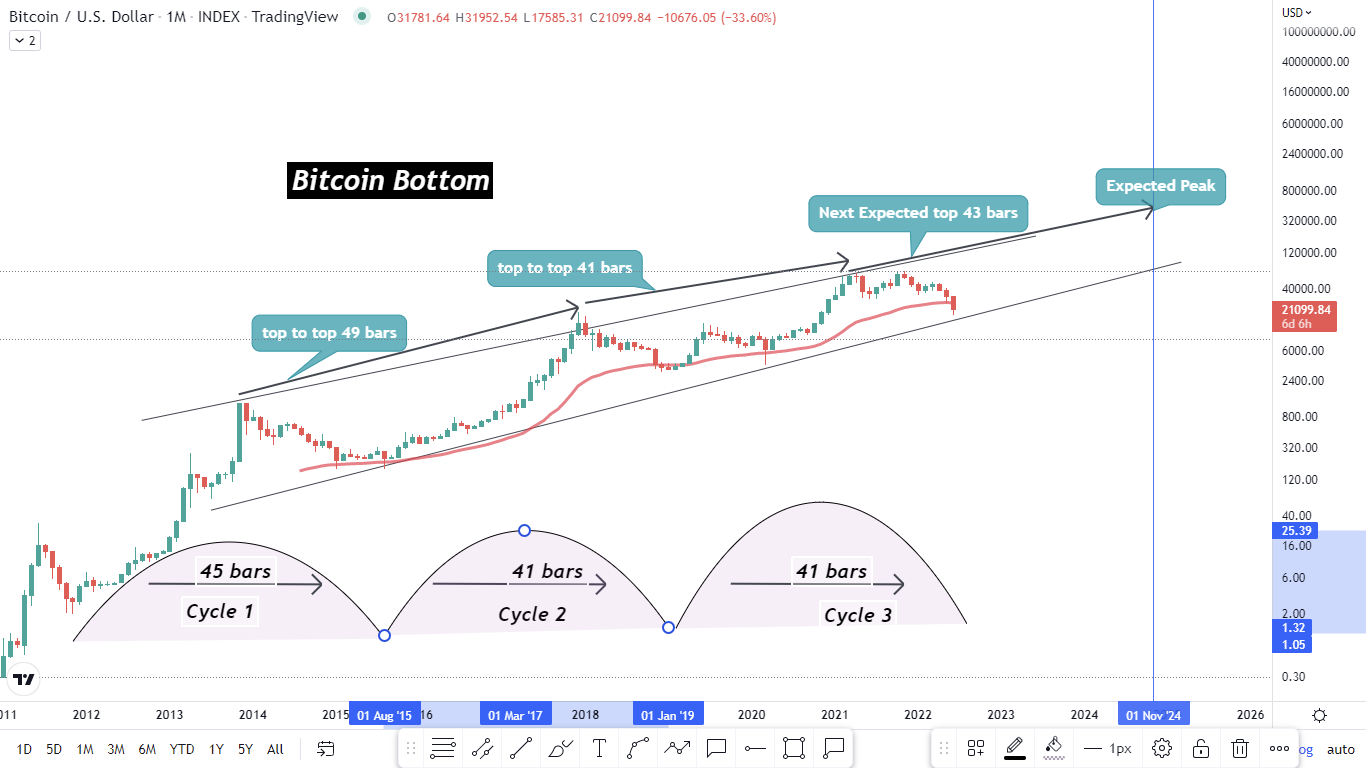
Price cycles are pattern repetitions in the chart. A cycle is as credible as many times as it has been repeated in the past. In addition, the cycle we’re discussing has been followed by Bitcoin since its first day, so there’s a weight that adds to its credibility.
- The first cycles started in 2011 and ended in 2015. The price rose from $2 to $1265 and dropped back to $173.
- In the second cycle, starting from $173 the price surged to $19,000 and plunged back to $3,400 between 2015 to 2019.
- We’re in the 3rd cycle and it is still in the making. Bitcoin price surged from the bottom of 2nd cycle to $69,000 and it’s currently trading at $20,000 after recording a low of $17,800.
Since it takes around 41 to 43 months to record a new bottom and the last bottom is 41 months away; therefore, it might take 1 to 3 months to decide new Bitcoin bottom. Moving Average 50 close has been acting as a support on a monthly chart over the years. Also, Bitcoin is moving like a ladder above a trend line which acts as a support. So, conclusively Bitcoin’s bottom might be between $17,000 and $14,000, and it will be decided in the next 1 to 3 months.
Conclusion
Don’t forget this analysis is our editorial opinion and NOT a financial advice. DYOR (Do Your Own Research) before investing, good luck and HODL.
more to read
Story of the Man Who Listed His Office as an NFT
Cyber Samurai: Next Evolution of NFT Staking
Follow NFT World News: Twitter, Instagram, Telegram, Tiktok, Youtube, Twitch
sources: tradingview
author: mnmansha
Disclaimer: This article is provided for informational purposes only. It is not offered or intended to be used as legal, tax, investment, financial, or other advice.
Disclaimer: This article is provided for informational purposes only. It is not offered or intended to be used as legal, tax, investment, financial, or other advice.