

Quick Summary:
- Though the bitcoinists keep predicting the end of the bearish trend for Bitcoin, these Top 5 On-Chain Indicators signal a strong trend shift.
- As 2022 is coming to an end already, these indicators can play a vital role in the trade activity of day traders and investors.
One of the most bearish Bitcoin years, 2022, is finally ending with a Bitcoin price below $20,000. Bitcoin plays a vital role in predicting the overall crypto market direction. Here are the top 5 on-chain indicators that suggest that the new Bitcoin bull run is approaching soon.
- BTC Price Drawdown from ATH
- Percent Supply in Profit
- Net Realized Profit/Loss
- Realized Profits-to-Value
- MVRV Z-score
Top 5 On-Chain Indicators
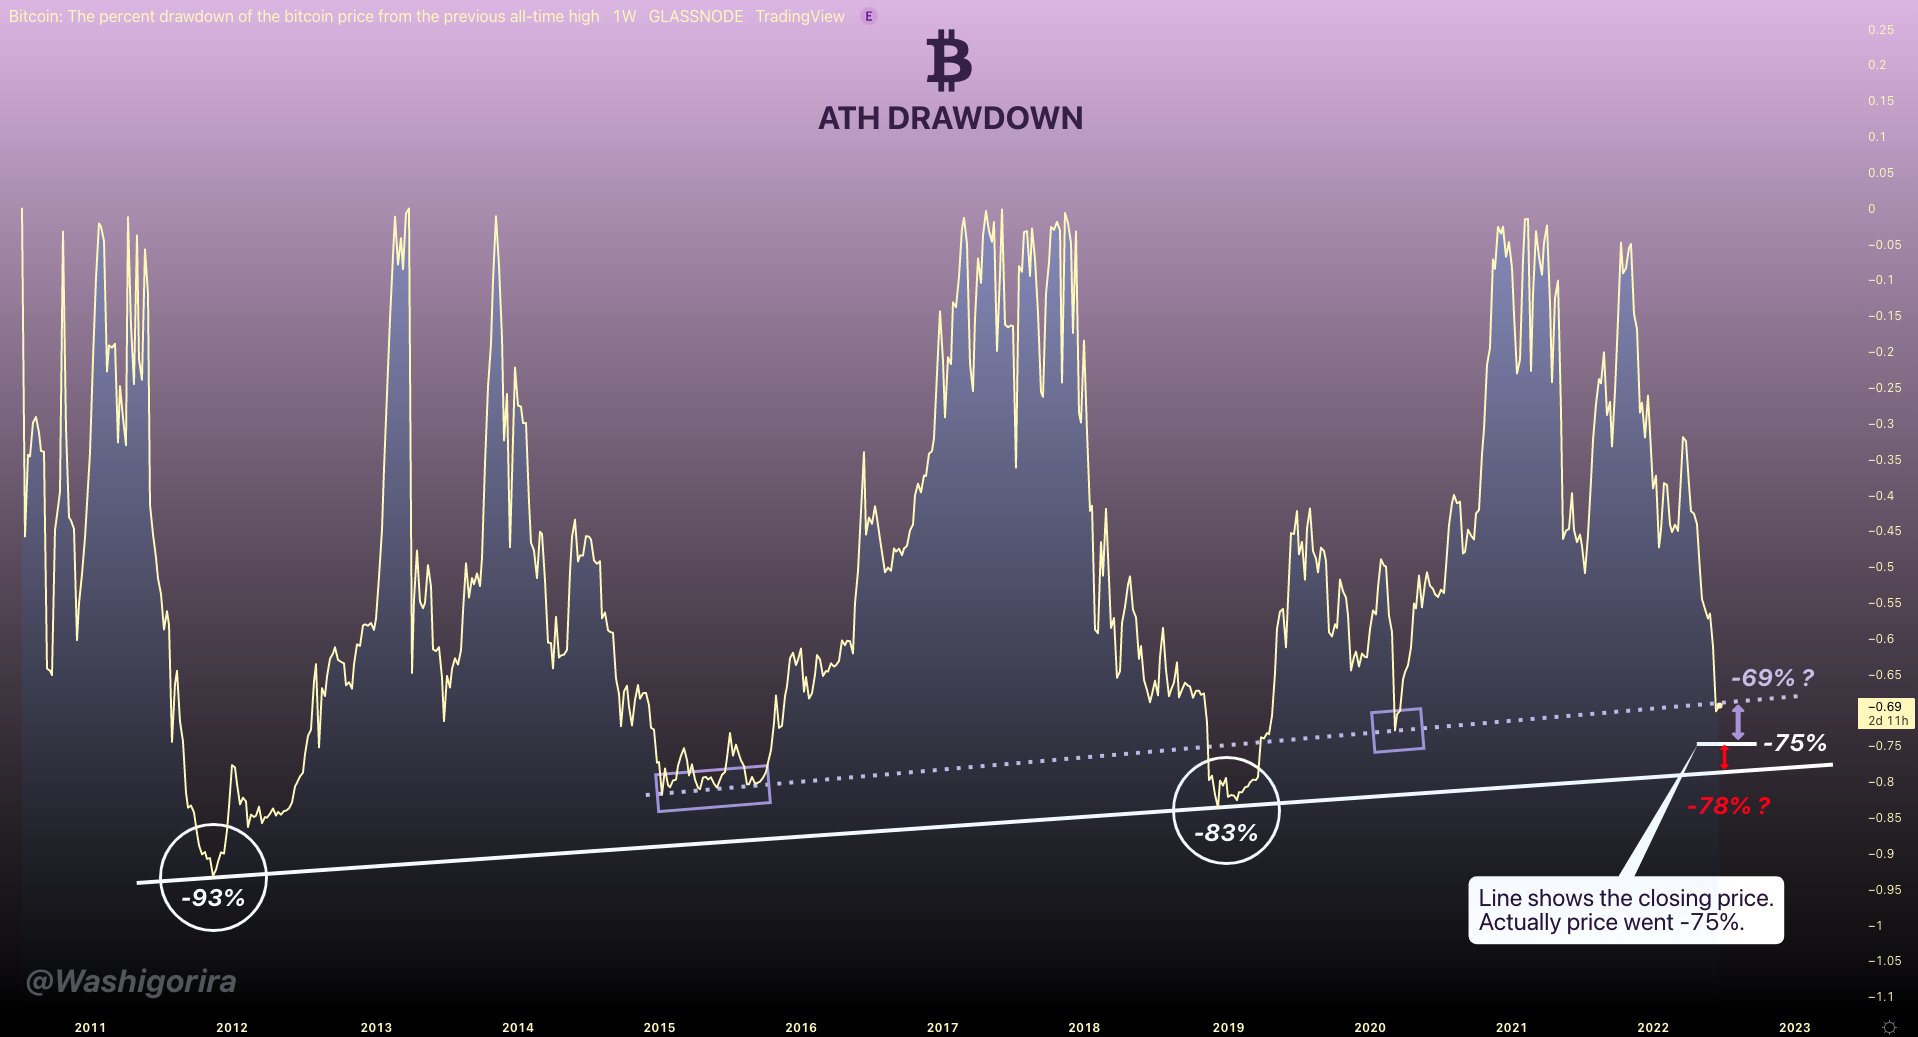
1. BTC Price Drawdown from ATH
In this indicator, the price of Bitcoin is drawn inverted where highs are shifted with the lows to analyze the price behavior. Bitcoin price cycle analysis tells us how Bitcoin price has been moving between highs and lows previously.
In the first cycle, Bitcoin dropped 93% before making a new all-time high. in the next cycle, it dropped 83% (10% less) making a slope. This slope suggests that this time’s bottom should be -78%. Interestingly, Bitcoin is already -75% from the ATH so it’s just a matter of -3% more downfall before it jumps to make another all-time high.
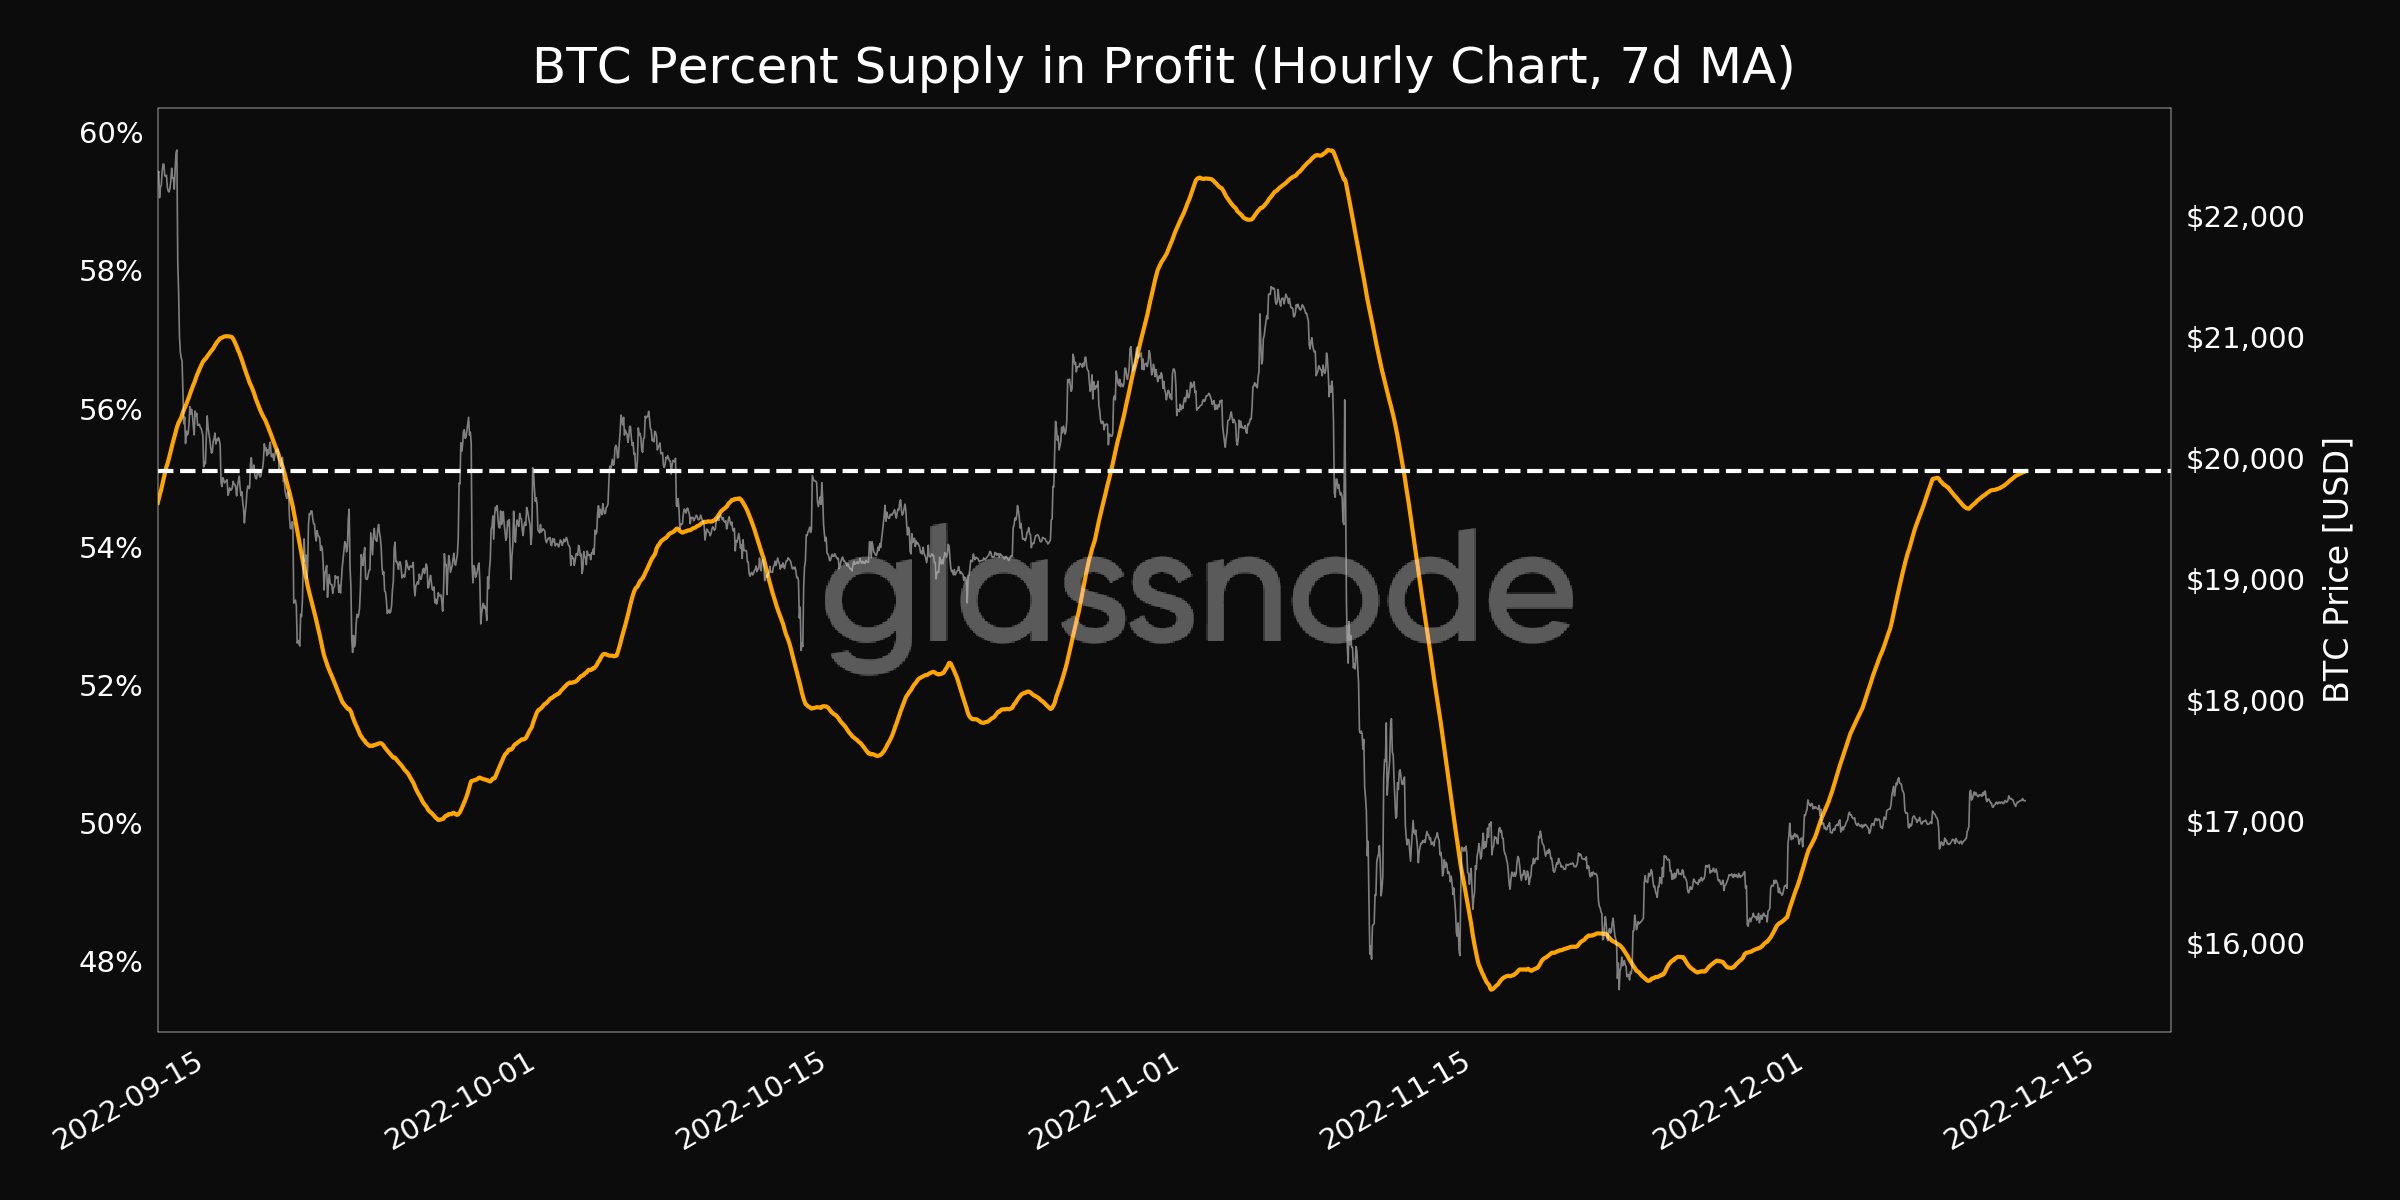
2. Percent Supply in Profit
Bitcoin percent supply hourly chart from Glassnode shows a huge bullish divergence. The percentage supply in profits is going to increase in the near future, as predicted by this technical indicator. The increase in addresses in profit is only possible if the price of Bitcoin increases.
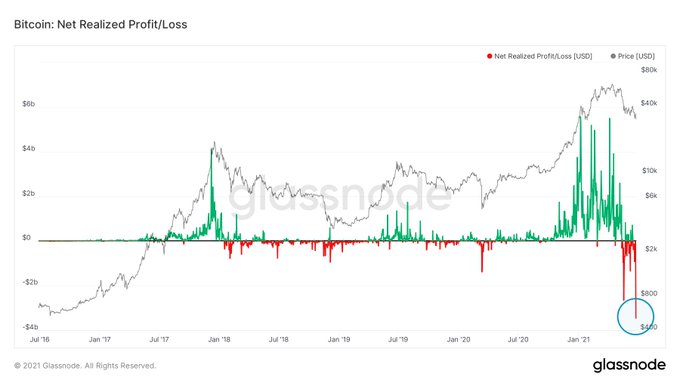
3. Net Realized Profit/Loss
The net realized profit/loss of Bitcoin is a minimum in history suggesting the lowest Bitcoin valuation. Previous crashes of Bitcoin were too milder compared to the current one.
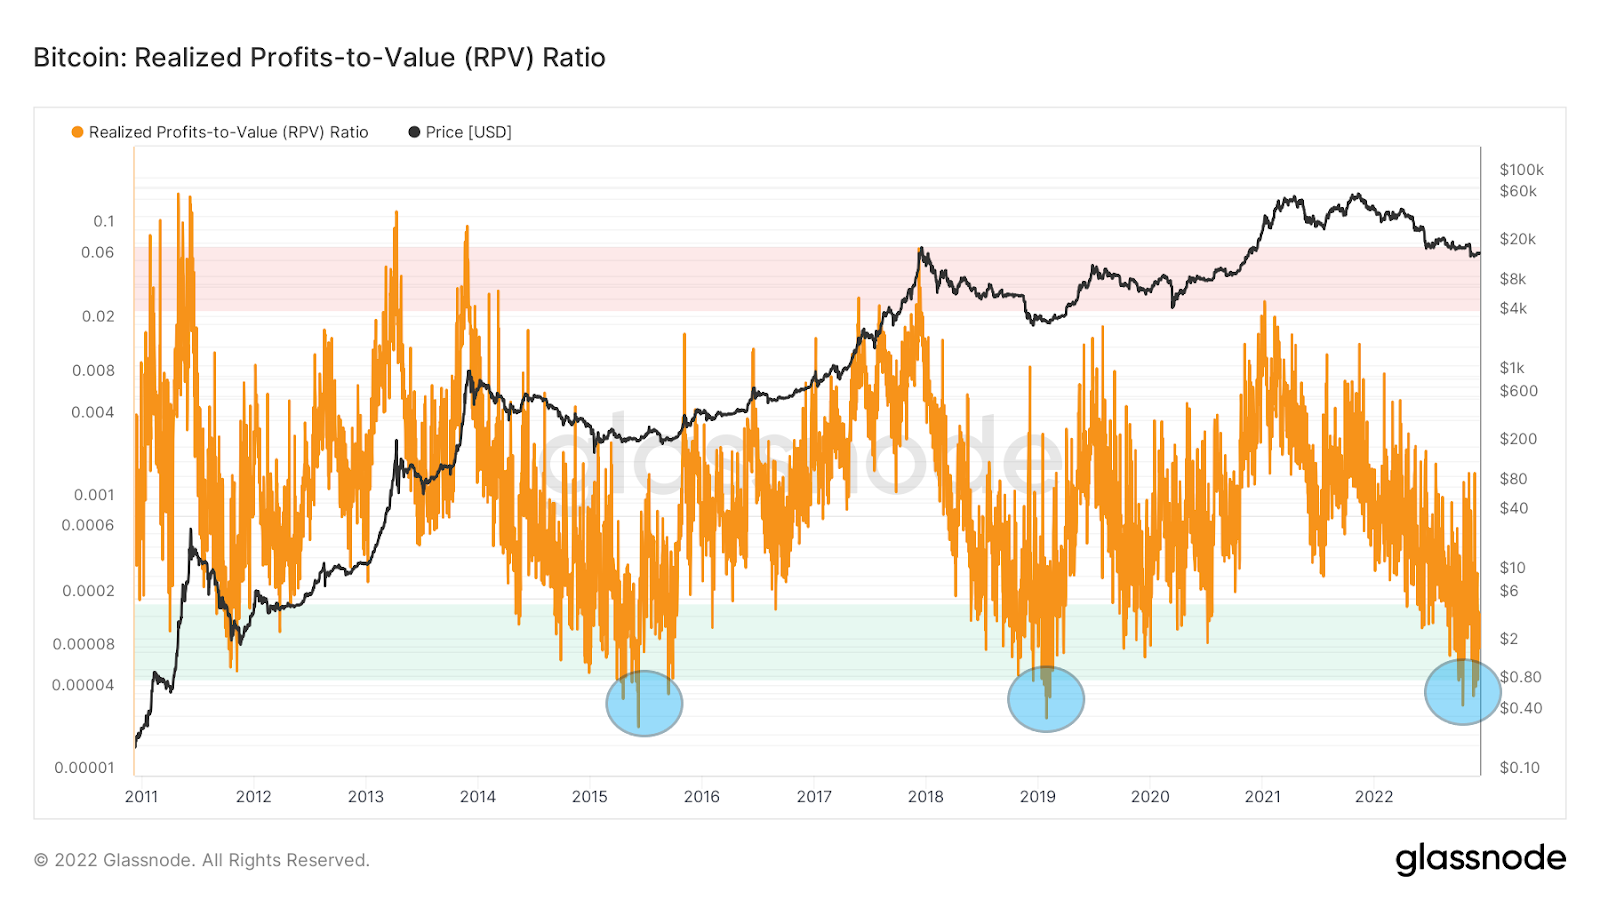
4. Realized Profits-to-Value
Data from Glassnode shows that there are significant opportunities to buy Bitcoin in the green region between 0.00005 and 0.00017. The indicator may even go below this range in extraordinary circumstances, which indicates fantastic purchasing possibilities.
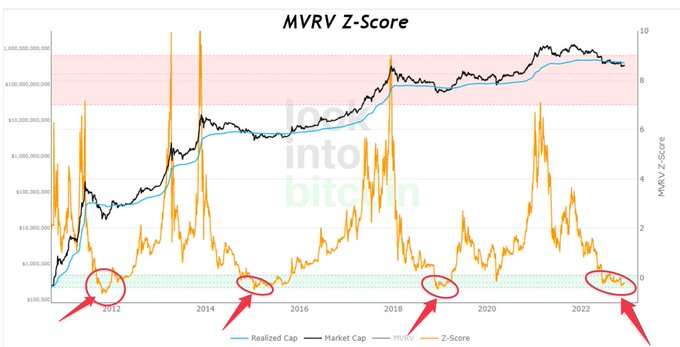
5. MVRV Z-score
MVRV Z-Score tells if Bitcoin is undervalued or overvalued. If Bitcoin reaches an overvalued area (red), the price drops below, likewise, if Bitcoin price drops to the undervalued area (green), this is the bottom for Bitcoin. Bitcoin now is in the undervalued area.
Conclusion:
The technical indicators are based on the previous price pattern and none of the patterns can predict the actual price movements. However, since their success percentage is higher, traders build their trust in using them.
The above analysis is just for educational purposes only, trade at your own risk. DYOR
Disclaimer: This article is provided for informational purposes only. It is not offered or intended to be used as legal, tax, investment, financial, or other advice.